cyp7 cwf27
| 0 | 1 | 2 | 3 | 4 | 5 | 6 | 7 | 8 | |
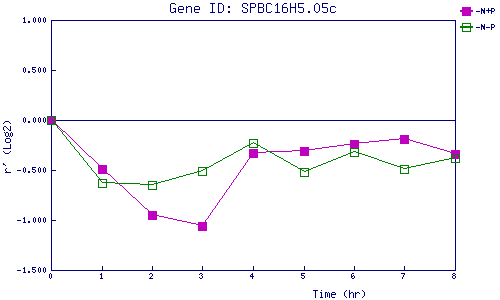
| -N+P | 0.000 | -0.487 | -0.953 | -1.056 | -0.329 | -0.308 | -0.242 | -0.194 | -0.340 |
| -N-P | 0.000 | -0.631 | -0.652 | -0.508 | -0.232 | -0.524 | -0.315 | -0.491 | -0.378 |
|
-N+P: Nitrogen starved in the presence of P-factor -N-P: Nitrogen starved in the absence of P-factor |