ppa2
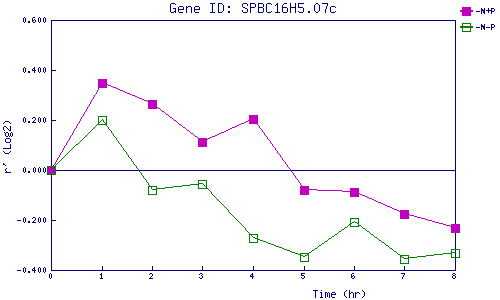
| 0 | 1 | 2 | 3 | 4 | 5 | 6 | 7 | 8 | |
| -N+P | 0.000 | 0.349 | 0.264 | 0.114 | 0.204 | -0.078 | -0.090 | -0.177 | -0.234 |
| -N-P | 0.000 | 0.201 | -0.080 | -0.056 | -0.271 | -0.349 | -0.206 | -0.355 | -0.331 |
|
-N+P: Nitrogen starved in the presence of P-factor -N-P: Nitrogen starved in the absence of P-factor |