| 0 | 1 | 2 | 3 | 4 | 5 | 6 | 7 | 8 | |
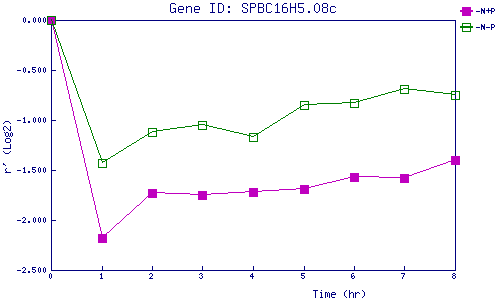
| -N+P | 0.000 | -2.177 | -1.735 | -1.750 | -1.724 | -1.694 | -1.573 | -1.581 | -1.403 |
| -N-P | 0.000 | -1.429 | -1.123 | -1.054 | -1.166 | -0.846 | -0.833 | -0.693 | -0.754 |
|
-N+P: Nitrogen starved in the presence of P-factor -N-P: Nitrogen starved in the absence of P-factor |