| 0 | 1 | 2 | 3 | 4 | 5 | 6 | 7 | 8 | |
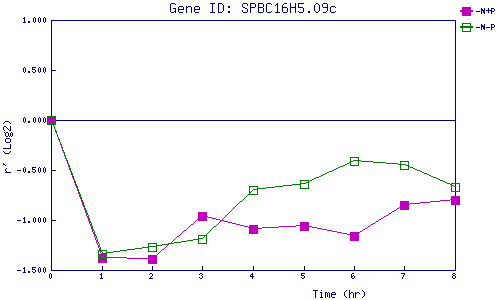
| -N+P | 0.000 | -1.384 | -1.391 | -0.955 | -1.091 | -1.064 | -1.158 | -0.849 | -0.800 |
| -N-P | 0.000 | -1.336 | -1.274 | -1.193 | -0.699 | -0.637 | -0.408 | -0.446 | -0.669 |
|
-N+P: Nitrogen starved in the presence of P-factor -N-P: Nitrogen starved in the absence of P-factor |