prp43
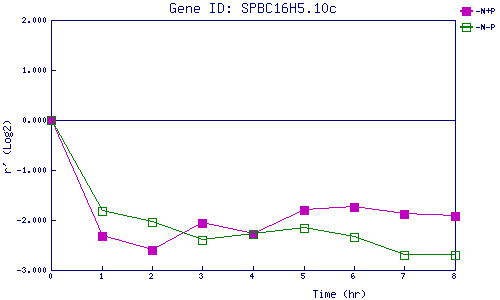
| 0 | 1 | 2 | 3 | 4 | 5 | 6 | 7 | 8 | |
| -N+P | 0.000 | -2.328 | -2.602 | -2.065 | -2.279 | -1.805 | -1.745 | -1.880 | -1.914 |
| -N-P | 0.000 | -1.811 | -2.040 | -2.392 | -2.289 | -2.170 | -2.331 | -2.693 | -2.707 |
|
-N+P: Nitrogen starved in the presence of P-factor -N-P: Nitrogen starved in the absence of P-factor |