skb1
| 0 | 1 | 2 | 3 | 4 | 5 | 6 | 7 | 8 | |
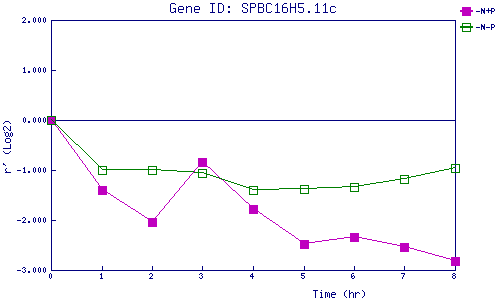
| -N+P | 0.000 | -1.406 | -2.049 | -0.831 | -1.773 | -2.482 | -2.338 | -2.534 | -2.811 |
| -N-P | 0.000 | -0.998 | -1.009 | -1.061 | -1.400 | -1.386 | -1.342 | -1.178 | -0.963 |
|
-N+P: Nitrogen starved in the presence of P-factor -N-P: Nitrogen starved in the absence of P-factor |