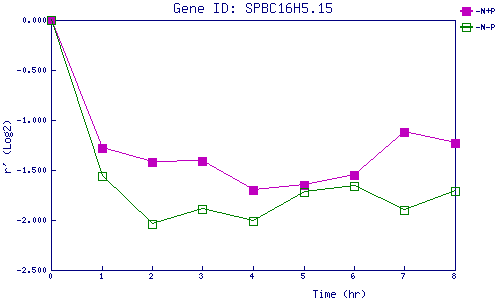
| 0 | 1 | 2 | 3 | 4 | 5 | 6 | 7 | 8 | |
| -N+P | 0.000 | -1.285 | -1.424 | -1.410 | -1.699 | -1.653 | -1.551 | -1.121 | -1.229 |
| -N-P | 0.000 | -1.563 | -2.043 | -1.889 | -2.008 | -1.724 | -1.662 | -1.902 | -1.706 |
|
-N+P: Nitrogen starved in the presence of P-factor -N-P: Nitrogen starved in the absence of P-factor |