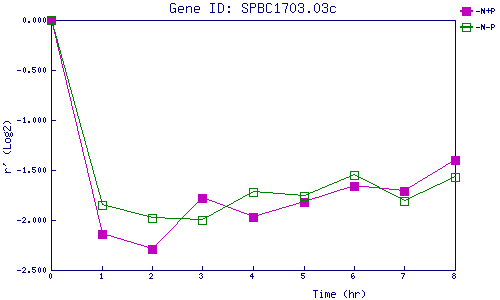
| 0 | 1 | 2 | 3 | 4 | 5 | 6 | 7 | 8 | |
| -N+P | 0.000 | -2.138 | -2.287 | -1.776 | -1.971 | -1.818 | -1.661 | -1.708 | -1.404 |
| -N-P | 0.000 | -1.852 | -1.984 | -1.996 | -1.721 | -1.765 | -1.547 | -1.812 | -1.570 |
|
-N+P: Nitrogen starved in the presence of P-factor -N-P: Nitrogen starved in the absence of P-factor |