| 0 | 1 | 2 | 3 | 4 | 5 | 6 | 7 | 8 | |
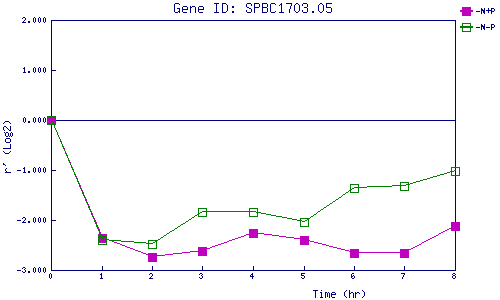
| -N+P | 0.000 | -2.361 | -2.741 | -2.627 | -2.252 | -2.407 | -2.666 | -2.651 | -2.111 |
| -N-P | 0.000 | -2.400 | -2.484 | -1.845 | -1.838 | -2.031 | -1.360 | -1.319 | -1.028 |
|
-N+P: Nitrogen starved in the presence of P-factor -N-P: Nitrogen starved in the absence of P-factor |