pof10
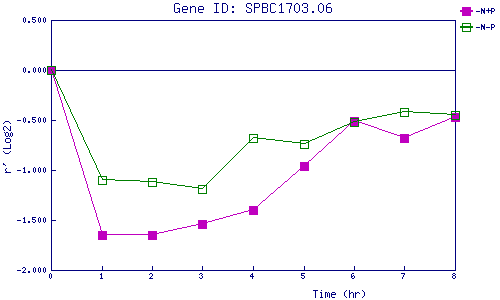
| 0 | 1 | 2 | 3 | 4 | 5 | 6 | 7 | 8 | |
| -N+P | 0.000 | -1.653 | -1.653 | -1.545 | -1.398 | -0.956 | -0.506 | -0.684 | -0.469 |
| -N-P | 0.000 | -1.102 | -1.124 | -1.187 | -0.681 | -0.737 | -0.517 | -0.418 | -0.452 |
|
-N+P: Nitrogen starved in the presence of P-factor -N-P: Nitrogen starved in the absence of P-factor |