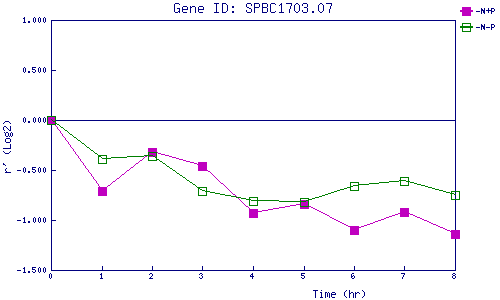
| 0 | 1 | 2 | 3 | 4 | 5 | 6 | 7 | 8 | |
| -N+P | 0.000 | -0.714 | -0.323 | -0.463 | -0.929 | -0.836 | -1.096 | -0.917 | -1.143 |
| -N-P | 0.000 | -0.391 | -0.365 | -0.712 | -0.813 | -0.822 | -0.665 | -0.614 | -0.746 |
|
-N+P: Nitrogen starved in the presence of P-factor -N-P: Nitrogen starved in the absence of P-factor |