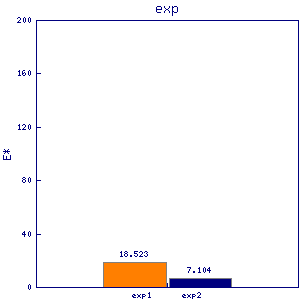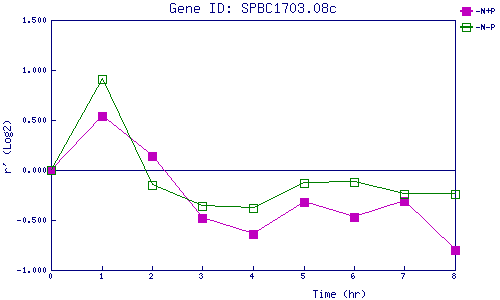
| 0 | 1 | 2 | 3 | 4 | 5 | 6 | 7 | 8 | |
| -N+P | 0.000 | 0.542 | 0.136 | -0.479 | -0.644 | -0.316 | -0.472 | -0.309 | -0.799 |
| -N-P | 0.000 | 0.907 | -0.152 | -0.359 | -0.380 | -0.127 | -0.124 | -0.236 | -0.235 |
|
-N+P: Nitrogen starved in the presence of P-factor -N-P: Nitrogen starved in the absence of P-factor |