reserved_name_ubp9 SPBTRNAPRO.07
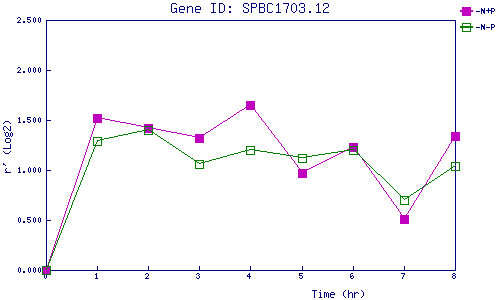
| 0 | 1 | 2 | 3 | 4 | 5 | 6 | 7 | 8 | |
| -N+P | 0.000 | 1.525 | 1.417 | 1.316 | 1.651 | 0.969 | 1.228 | 0.507 | 1.338 |
| -N-P | 0.000 | 1.288 | 1.404 | 1.055 | 1.196 | 1.116 | 1.202 | 0.699 | 1.036 |
|
-N+P: Nitrogen starved in the presence of P-factor -N-P: Nitrogen starved in the absence of P-factor |