top1
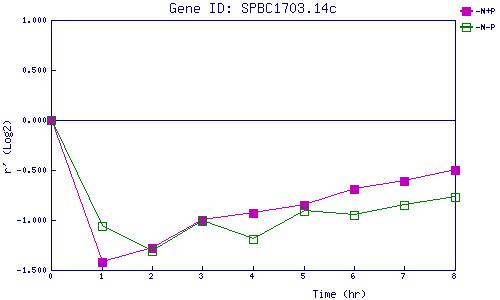
| 0 | 1 | 2 | 3 | 4 | 5 | 6 | 7 | 8 | |
| -N+P | 0.000 | -1.421 | -1.276 | -1.002 | -0.930 | -0.851 | -0.689 | -0.608 | -0.501 |
| -N-P | 0.000 | -1.060 | -1.313 | -1.006 | -1.187 | -0.910 | -0.954 | -0.848 | -0.767 |
|
-N+P: Nitrogen starved in the presence of P-factor -N-P: Nitrogen starved in the absence of P-factor |