wtf2 wtf5-pseudo
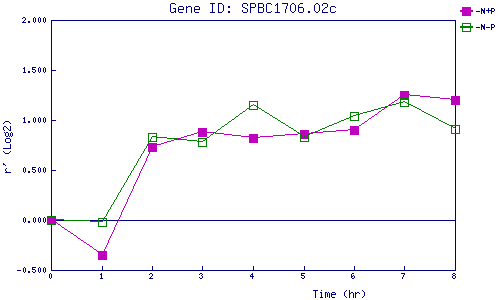
| 0 | 1 | 2 | 3 | 4 | 5 | 6 | 7 | 8 | |
| -N+P | 0.000 | -0.354 | 0.730 | 0.882 | 0.818 | 0.864 | 0.899 | 1.252 | 1.200 |
| -N-P | 0.000 | -0.023 | 0.832 | 0.775 | 1.150 | 0.826 | 1.041 | 1.181 | 0.908 |
|
-N+P: Nitrogen starved in the presence of P-factor -N-P: Nitrogen starved in the absence of P-factor |