cyp3
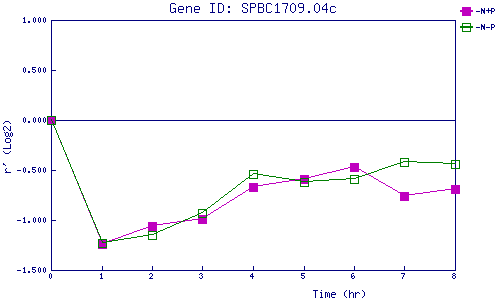
| 0 | 1 | 2 | 3 | 4 | 5 | 6 | 7 | 8 | |
| -N+P | 0.000 | -1.243 | -1.062 | -0.994 | -0.674 | -0.589 | -0.469 | -0.760 | -0.689 |
| -N-P | 0.000 | -1.226 | -1.148 | -0.927 | -0.543 | -0.625 | -0.589 | -0.415 | -0.436 |
|
-N+P: Nitrogen starved in the presence of P-factor -N-P: Nitrogen starved in the absence of P-factor |