sks2 hsc1
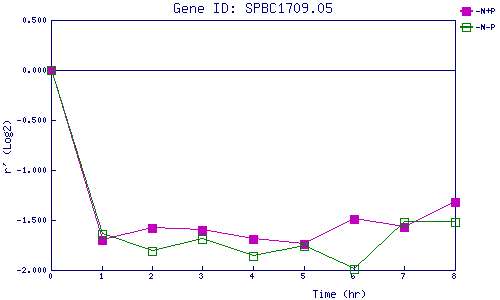
| 0 | 1 | 2 | 3 | 4 | 5 | 6 | 7 | 8 | |
| -N+P | 0.000 | -1.704 | -1.576 | -1.604 | -1.687 | -1.744 | -1.488 | -1.568 | -1.323 |
| -N-P | 0.000 | -1.645 | -1.810 | -1.692 | -1.856 | -1.760 | -1.988 | -1.522 | -1.515 |
|
-N+P: Nitrogen starved in the presence of P-factor -N-P: Nitrogen starved in the absence of P-factor |