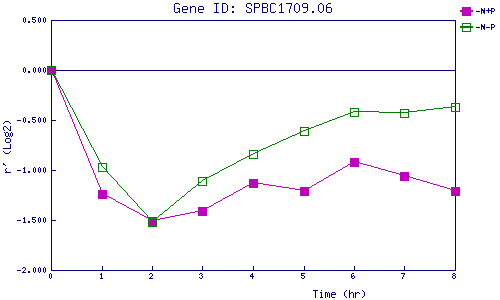
| 0 | 1 | 2 | 3 | 4 | 5 | 6 | 7 | 8 | |
| -N+P | 0.000 | -1.244 | -1.513 | -1.406 | -1.133 | -1.211 | -0.920 | -1.063 | -1.206 |
| -N-P | 0.000 | -0.970 | -1.519 | -1.112 | -0.838 | -0.609 | -0.424 | -0.433 | -0.370 |
|
-N+P: Nitrogen starved in the presence of P-factor -N-P: Nitrogen starved in the absence of P-factor |