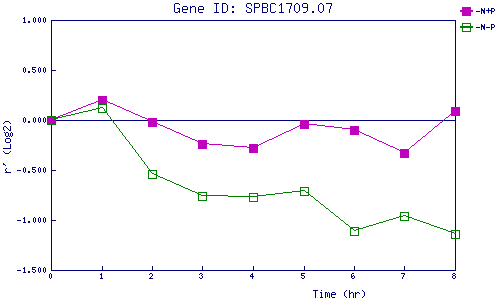
| 0 | 1 | 2 | 3 | 4 | 5 | 6 | 7 | 8 | |
| -N+P | 0.000 | 0.205 | -0.015 | -0.236 | -0.279 | -0.042 | -0.100 | -0.330 | 0.086 |
| -N-P | 0.000 | 0.124 | -0.538 | -0.758 | -0.767 | -0.711 | -1.111 | -0.957 | -1.145 |
|
-N+P: Nitrogen starved in the presence of P-factor -N-P: Nitrogen starved in the absence of P-factor |