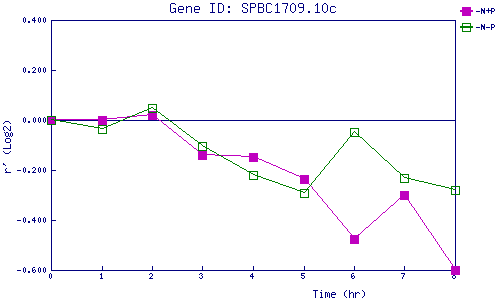
| 0 | 1 | 2 | 3 | 4 | 5 | 6 | 7 | 8 | |
| -N+P | 0.000 | -0.001 | 0.020 | -0.139 | -0.148 | -0.236 | -0.475 | -0.300 | -0.599 |
| -N-P | 0.000 | -0.036 | 0.049 | -0.105 | -0.219 | -0.292 | -0.050 | -0.230 | -0.282 |
|
-N+P: Nitrogen starved in the presence of P-factor -N-P: Nitrogen starved in the absence of P-factor |