| 0 | 1 | 2 | 3 | 4 | 5 | 6 | 7 | 8 | |
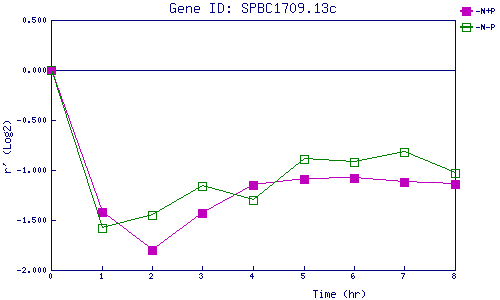
| -N+P | 0.000 | -1.416 | -1.804 | -1.431 | -1.148 | -1.086 | -1.077 | -1.118 | -1.145 |
| -N-P | 0.000 | -1.585 | -1.448 | -1.162 | -1.302 | -0.891 | -0.916 | -0.817 | -1.026 |
|
-N+P: Nitrogen starved in the presence of P-factor -N-P: Nitrogen starved in the absence of P-factor |