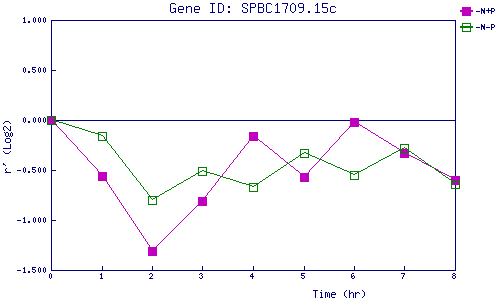
| 0 | 1 | 2 | 3 | 4 | 5 | 6 | 7 | 8 | |
| -N+P | 0.000 | -0.557 | -1.308 | -0.808 | -0.159 | -0.567 | -0.021 | -0.334 | -0.596 |
| -N-P | 0.000 | -0.158 | -0.795 | -0.513 | -0.672 | -0.328 | -0.547 | -0.283 | -0.638 |
|
-N+P: Nitrogen starved in the presence of P-factor -N-P: Nitrogen starved in the absence of P-factor |