tif452
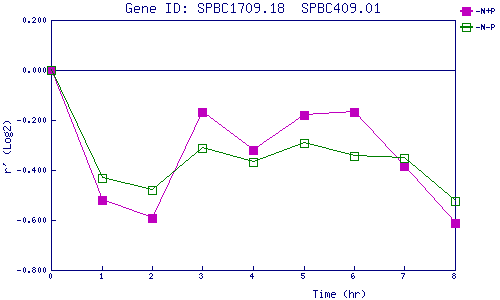
| 0 | 1 | 2 | 3 | 4 | 5 | 6 | 7 | 8 | |
| -N+P | 0.000 | -0.520 | -0.592 | -0.167 | -0.321 | -0.181 | -0.169 | -0.384 | -0.613 |
| -N-P | 0.000 | -0.432 | -0.479 | -0.311 | -0.369 | -0.293 | -0.344 | -0.351 | -0.524 |
|
-N+P: Nitrogen starved in the presence of P-factor -N-P: Nitrogen starved in the absence of P-factor |