| 0 | 1 | 2 | 3 | 4 | 5 | 6 | 7 | 8 | |
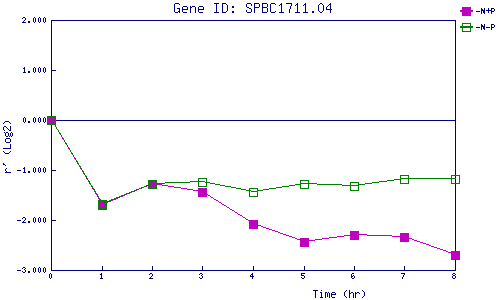
| -N+P | 0.000 | -1.703 | -1.278 | -1.437 | -2.071 | -2.438 | -2.304 | -2.332 | -2.691 |
| -N-P | 0.000 | -1.672 | -1.274 | -1.230 | -1.444 | -1.273 | -1.314 | -1.178 | -1.181 |
|
-N+P: Nitrogen starved in the presence of P-factor -N-P: Nitrogen starved in the absence of P-factor |