| 0 | 1 | 2 | 3 | 4 | 5 | 6 | 7 | 8 | |
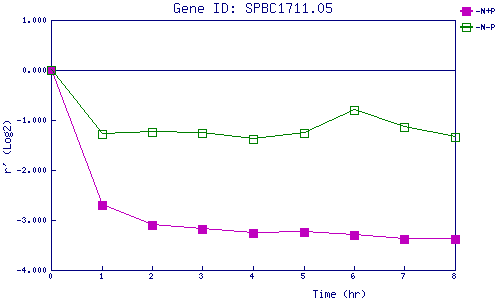
| -N+P | 0.000 | -2.694 | -3.105 | -3.185 | -3.259 | -3.243 | -3.295 | -3.381 | -3.385 |
| -N-P | 0.000 | -1.286 | -1.230 | -1.267 | -1.371 | -1.252 | -0.796 | -1.136 | -1.339 |
|
-N+P: Nitrogen starved in the presence of P-factor -N-P: Nitrogen starved in the absence of P-factor |