rpl4 rpl402 rpl4-2
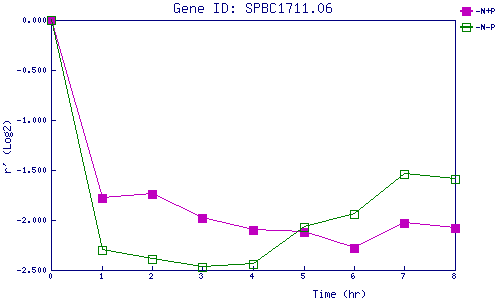
| 0 | 1 | 2 | 3 | 4 | 5 | 6 | 7 | 8 | |
| -N+P | 0.000 | -1.781 | -1.741 | -1.982 | -2.096 | -2.116 | -2.283 | -2.033 | -2.081 |
| -N-P | 0.000 | -2.301 | -2.386 | -2.467 | -2.443 | -2.072 | -1.939 | -1.541 | -1.592 |
|
-N+P: Nitrogen starved in the presence of P-factor -N-P: Nitrogen starved in the absence of P-factor |