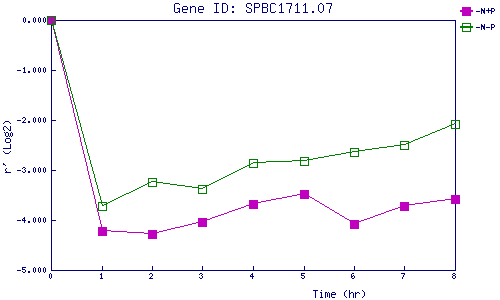
| 0 | 1 | 2 | 3 | 4 | 5 | 6 | 7 | 8 | |
| -N+P | 0.000 | -4.226 | -4.274 | -4.044 | -3.677 | -3.485 | -4.071 | -3.730 | -3.585 |
| -N-P | 0.000 | -3.714 | -3.240 | -3.371 | -2.858 | -2.823 | -2.645 | -2.499 | -2.076 |
|
-N+P: Nitrogen starved in the presence of P-factor -N-P: Nitrogen starved in the absence of P-factor |