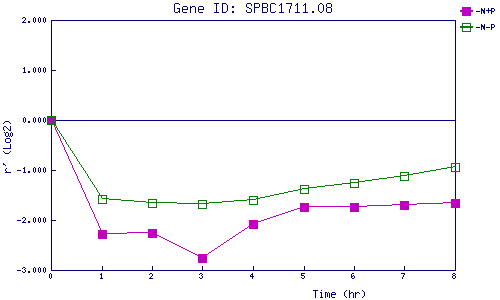
| 0 | 1 | 2 | 3 | 4 | 5 | 6 | 7 | 8 | |
| -N+P | 0.000 | -2.286 | -2.263 | -2.763 | -2.090 | -1.749 | -1.738 | -1.706 | -1.668 |
| -N-P | 0.000 | -1.573 | -1.665 | -1.672 | -1.602 | -1.382 | -1.257 | -1.127 | -0.944 |
|
-N+P: Nitrogen starved in the presence of P-factor -N-P: Nitrogen starved in the absence of P-factor |