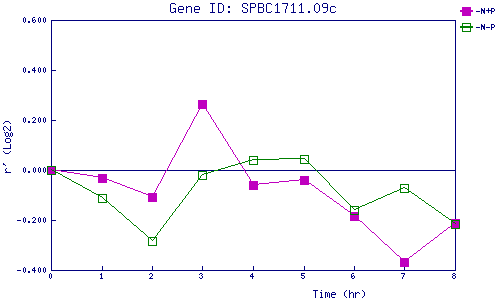
| 0 | 1 | 2 | 3 | 4 | 5 | 6 | 7 | 8 | |
| -N+P | 0.000 | -0.031 | -0.109 | 0.264 | -0.061 | -0.040 | -0.186 | -0.370 | -0.213 |
| -N-P | 0.000 | -0.110 | -0.283 | -0.020 | 0.041 | 0.043 | -0.159 | -0.070 | -0.218 |
|
-N+P: Nitrogen starved in the presence of P-factor -N-P: Nitrogen starved in the absence of P-factor |