his2
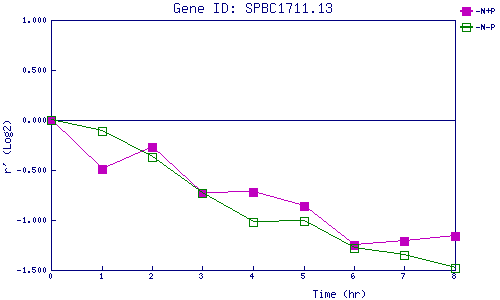
| 0 | 1 | 2 | 3 | 4 | 5 | 6 | 7 | 8 | |
| -N+P | 0.000 | -0.493 | -0.268 | -0.727 | -0.715 | -0.858 | -1.252 | -1.210 | -1.165 |
| -N-P | 0.000 | -0.107 | -0.372 | -0.732 | -1.021 | -1.011 | -1.277 | -1.347 | -1.481 |
|
-N+P: Nitrogen starved in the presence of P-factor -N-P: Nitrogen starved in the absence of P-factor |