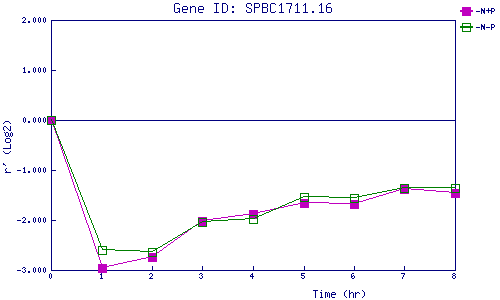
| 0 | 1 | 2 | 3 | 4 | 5 | 6 | 7 | 8 | |
| -N+P | 0.000 | -2.965 | -2.738 | -2.021 | -1.877 | -1.664 | -1.682 | -1.373 | -1.460 |
| -N-P | 0.000 | -2.593 | -2.638 | -2.043 | -1.971 | -1.543 | -1.552 | -1.351 | -1.366 |
|
-N+P: Nitrogen starved in the presence of P-factor -N-P: Nitrogen starved in the absence of P-factor |