ker1
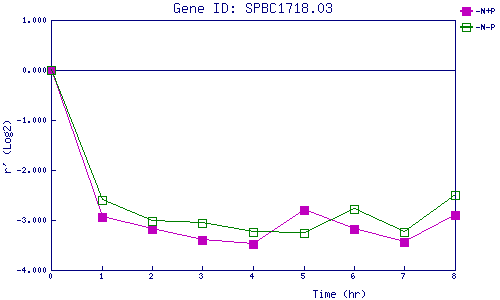
| 0 | 1 | 2 | 3 | 4 | 5 | 6 | 7 | 8 | |
| -N+P | 0.000 | -2.947 | -3.177 | -3.394 | -3.485 | -2.796 | -3.174 | -3.432 | -2.904 |
| -N-P | 0.000 | -2.610 | -3.025 | -3.054 | -3.243 | -3.253 | -2.789 | -3.250 | -2.505 |
|
-N+P: Nitrogen starved in the presence of P-factor -N-P: Nitrogen starved in the absence of P-factor |
