trs31
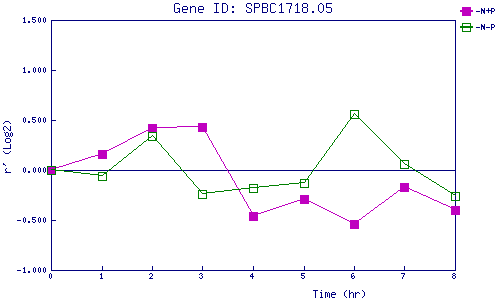
| 0 | 1 | 2 | 3 | 4 | 5 | 6 | 7 | 8 | |
| -N+P | 0.000 | 0.165 | 0.415 | 0.426 | -0.460 | -0.288 | -0.543 | -0.169 | -0.405 |
| -N-P | 0.000 | -0.062 | 0.340 | -0.236 | -0.181 | -0.130 | 0.556 | 0.057 | -0.265 |
|
-N+P: Nitrogen starved in the presence of P-factor -N-P: Nitrogen starved in the absence of P-factor |