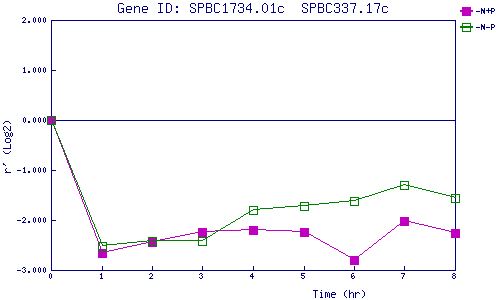
| 0 | 1 | 2 | 3 | 4 | 5 | 6 | 7 | 8 | |
| -N+P | 0.000 | -2.652 | -2.435 | -2.240 | -2.190 | -2.238 | -2.791 | -2.015 | -2.266 |
| -N-P | 0.000 | -2.513 | -2.411 | -2.428 | -1.790 | -1.720 | -1.626 | -1.297 | -1.561 |
|
-N+P: Nitrogen starved in the presence of P-factor -N-P: Nitrogen starved in the absence of P-factor |