cdc27
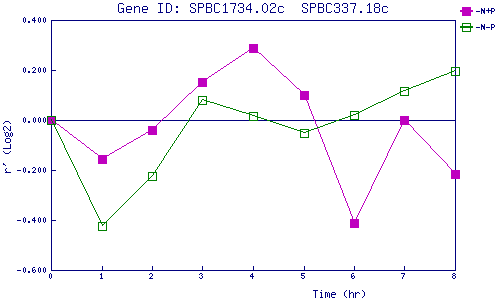
| 0 | 1 | 2 | 3 | 4 | 5 | 6 | 7 | 8 | |
| -N+P | 0.000 | -0.157 | -0.042 | 0.150 | 0.286 | 0.099 | -0.412 | 0.001 | -0.218 |
| -N-P | 0.000 | -0.424 | -0.226 | 0.080 | 0.015 | -0.053 | 0.019 | 0.117 | 0.195 |
|
-N+P: Nitrogen starved in the presence of P-factor -N-P: Nitrogen starved in the absence of P-factor |