spf31
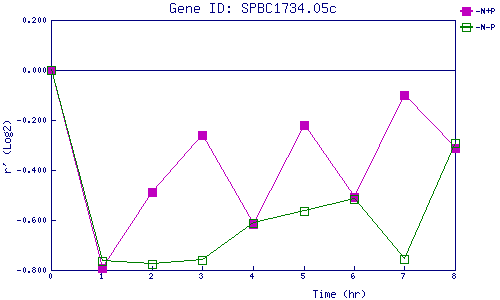
| 0 | 1 | 2 | 3 | 4 | 5 | 6 | 7 | 8 | |
| -N+P | 0.000 | -0.792 | -0.488 | -0.259 | -0.615 | -0.221 | -0.508 | -0.101 | -0.313 |
| -N-P | 0.000 | -0.764 | -0.777 | -0.759 | -0.612 | -0.564 | -0.517 | -0.757 | -0.291 |
|
-N+P: Nitrogen starved in the presence of P-factor -N-P: Nitrogen starved in the absence of P-factor |