rhp18
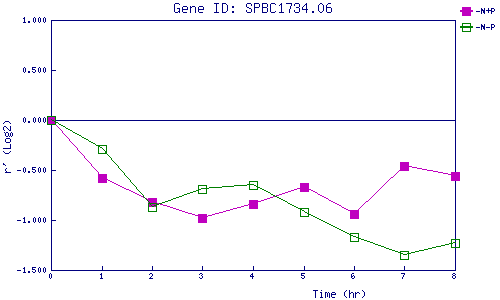
| 0 | 1 | 2 | 3 | 4 | 5 | 6 | 7 | 8 | |
| -N+P | 0.000 | -0.580 | -0.823 | -0.982 | -0.842 | -0.672 | -0.941 | -0.456 | -0.563 |
| -N-P | 0.000 | -0.292 | -0.867 | -0.689 | -0.649 | -0.924 | -1.173 | -1.354 | -1.230 |
|
-N+P: Nitrogen starved in the presence of P-factor -N-P: Nitrogen starved in the absence of P-factor |