| 0 | 1 | 2 | 3 | 4 | 5 | 6 | 7 | 8 | |
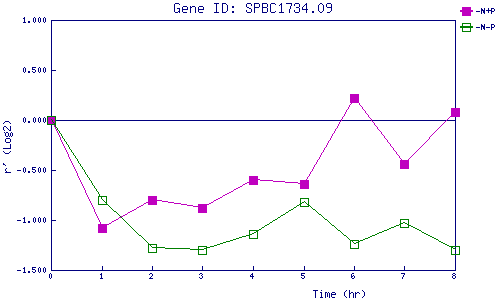
| -N+P | 0.000 | -1.085 | -0.802 | -0.877 | -0.596 | -0.642 | 0.218 | -0.435 | 0.079 |
| -N-P | 0.000 | -0.803 | -1.280 | -1.296 | -1.144 | -0.822 | -1.238 | -1.034 | -1.301 |
|
-N+P: Nitrogen starved in the presence of P-factor -N-P: Nitrogen starved in the absence of P-factor |