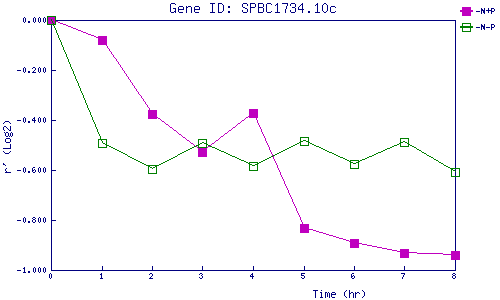
| 0 | 1 | 2 | 3 | 4 | 5 | 6 | 7 | 8 | |
| -N+P | 0.000 | -0.079 | -0.376 | -0.529 | -0.372 | -0.831 | -0.891 | -0.932 | -0.940 |
| -N-P | 0.000 | -0.493 | -0.595 | -0.491 | -0.585 | -0.483 | -0.577 | -0.490 | -0.610 |
|
-N+P: Nitrogen starved in the presence of P-factor -N-P: Nitrogen starved in the absence of P-factor |