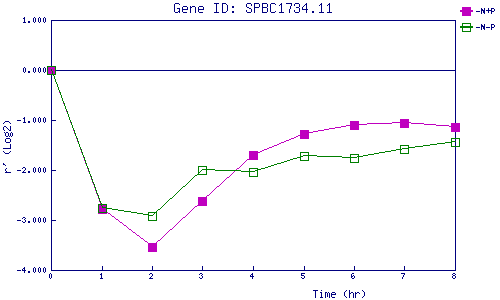
| 0 | 1 | 2 | 3 | 4 | 5 | 6 | 7 | 8 | |
| -N+P | 0.000 | -2.774 | -3.539 | -2.616 | -1.697 | -1.284 | -1.098 | -1.067 | -1.131 |
| -N-P | 0.000 | -2.762 | -2.927 | -2.010 | -2.035 | -1.728 | -1.757 | -1.579 | -1.438 |
|
-N+P: Nitrogen starved in the presence of P-factor -N-P: Nitrogen starved in the absence of P-factor |