suc1
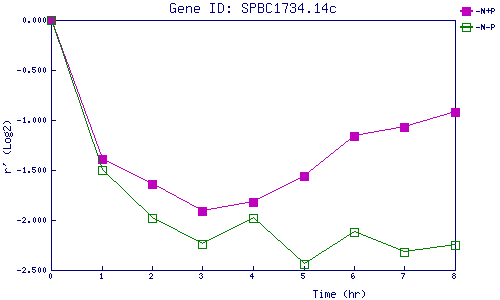
| 0 | 1 | 2 | 3 | 4 | 5 | 6 | 7 | 8 | |
| -N+P | 0.000 | -1.390 | -1.645 | -1.909 | -1.817 | -1.562 | -1.162 | -1.071 | -0.923 |
| -N-P | 0.000 | -1.500 | -1.984 | -2.237 | -1.985 | -2.443 | -2.116 | -2.318 | -2.249 |
|
-N+P: Nitrogen starved in the presence of P-factor -N-P: Nitrogen starved in the absence of P-factor |