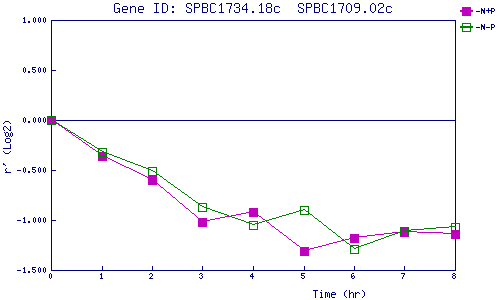
| 0 | 1 | 2 | 3 | 4 | 5 | 6 | 7 | 8 | |
| -N+P | 0.000 | -0.361 | -0.605 | -1.017 | -0.920 | -1.314 | -1.175 | -1.122 | -1.143 |
| -N-P | 0.000 | -0.317 | -0.509 | -0.869 | -1.052 | -0.900 | -1.293 | -1.114 | -1.070 |
|
-N+P: Nitrogen starved in the presence of P-factor -N-P: Nitrogen starved in the absence of P-factor |