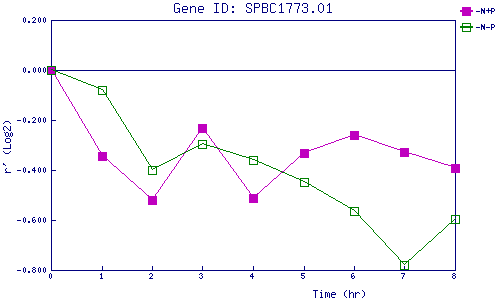
| 0 | 1 | 2 | 3 | 4 | 5 | 6 | 7 | 8 | |
| -N+P | 0.000 | -0.342 | -0.520 | -0.234 | -0.512 | -0.331 | -0.259 | -0.329 | -0.392 |
| -N-P | 0.000 | -0.080 | -0.401 | -0.297 | -0.358 | -0.449 | -0.564 | -0.780 | -0.597 |
|
-N+P: Nitrogen starved in the presence of P-factor -N-P: Nitrogen starved in the absence of P-factor |