sbp1 yrb1
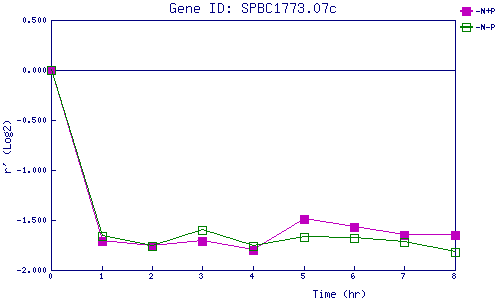
| 0 | 1 | 2 | 3 | 4 | 5 | 6 | 7 | 8 | |
| -N+P | 0.000 | -1.708 | -1.764 | -1.711 | -1.795 | -1.489 | -1.570 | -1.650 | -1.650 |
| -N-P | 0.000 | -1.664 | -1.760 | -1.601 | -1.756 | -1.668 | -1.676 | -1.719 | -1.816 |
|
-N+P: Nitrogen starved in the presence of P-factor -N-P: Nitrogen starved in the absence of P-factor |