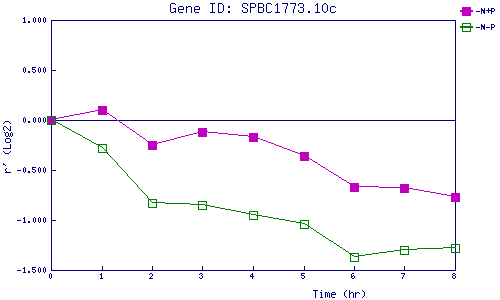
| 0 | 1 | 2 | 3 | 4 | 5 | 6 | 7 | 8 | |
| -N+P | 0.000 | 0.104 | -0.254 | -0.125 | -0.167 | -0.355 | -0.674 | -0.682 | -0.772 |
| -N-P | 0.000 | -0.275 | -0.828 | -0.847 | -0.948 | -1.040 | -1.372 | -1.295 | -1.277 |
|
-N+P: Nitrogen starved in the presence of P-factor -N-P: Nitrogen starved in the absence of P-factor |