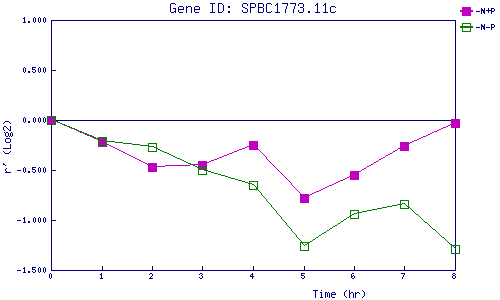
| 0 | 1 | 2 | 3 | 4 | 5 | 6 | 7 | 8 | |
| -N+P | 0.000 | -0.215 | -0.471 | -0.449 | -0.247 | -0.782 | -0.553 | -0.259 | -0.029 |
| -N-P | 0.000 | -0.211 | -0.272 | -0.501 | -0.653 | -1.260 | -0.943 | -0.838 | -1.293 |
|
-N+P: Nitrogen starved in the presence of P-factor -N-P: Nitrogen starved in the absence of P-factor |