spo6
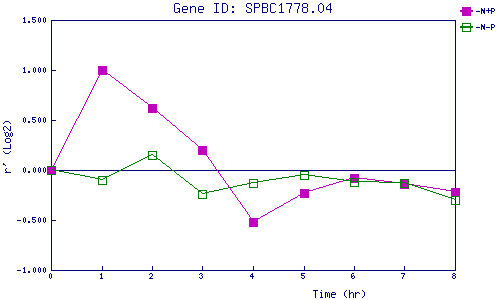
| 0 | 1 | 2 | 3 | 4 | 5 | 6 | 7 | 8 | |
| -N+P | 0.000 | 1.000 | 0.618 | 0.201 | -0.518 | -0.228 | -0.080 | -0.141 | -0.216 |
| -N-P | 0.000 | -0.096 | 0.147 | -0.241 | -0.132 | -0.046 | -0.118 | -0.131 | -0.299 |
|
-N+P: Nitrogen starved in the presence of P-factor -N-P: Nitrogen starved in the absence of P-factor |