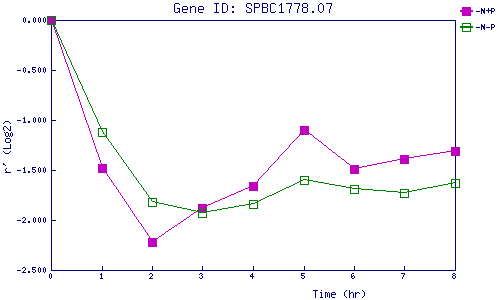
| 0 | 1 | 2 | 3 | 4 | 5 | 6 | 7 | 8 | |
| -N+P | 0.000 | -1.485 | -2.223 | -1.879 | -1.656 | -1.099 | -1.486 | -1.387 | -1.311 |
| -N-P | 0.000 | -1.115 | -1.824 | -1.934 | -1.836 | -1.605 | -1.689 | -1.734 | -1.626 |
|
-N+P: Nitrogen starved in the presence of P-factor -N-P: Nitrogen starved in the absence of P-factor |