pi040
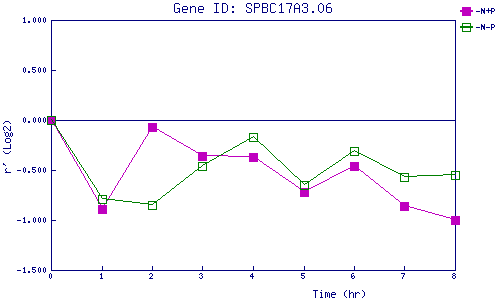
| 0 | 1 | 2 | 3 | 4 | 5 | 6 | 7 | 8 | |
| -N+P | 0.000 | -0.889 | -0.067 | -0.356 | -0.370 | -0.716 | -0.463 | -0.858 | -1.003 |
| -N-P | 0.000 | -0.788 | -0.846 | -0.459 | -0.174 | -0.649 | -0.311 | -0.574 | -0.551 |
|
-N+P: Nitrogen starved in the presence of P-factor -N-P: Nitrogen starved in the absence of P-factor |