pgr1 pi039
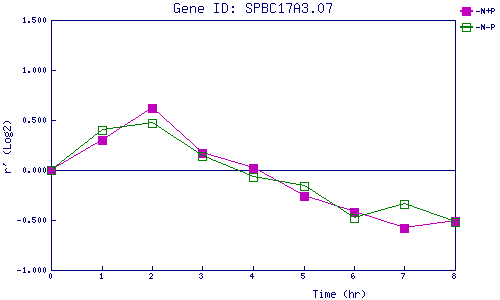
| 0 | 1 | 2 | 3 | 4 | 5 | 6 | 7 | 8 | |
| -N+P | 0.000 | 0.300 | 0.620 | 0.171 | 0.020 | -0.261 | -0.424 | -0.584 | -0.512 |
| -N-P | 0.000 | 0.398 | 0.472 | 0.137 | -0.066 | -0.156 | -0.477 | -0.343 | -0.517 |
|
-N+P: Nitrogen starved in the presence of P-factor -N-P: Nitrogen starved in the absence of P-factor |